How to Create Infographics Using ChatGPT
Creating visual content is a big part of my daily routine as a content creator. Infographics, especially, have always felt challenging because they usually require some level of design skills.
ChatGPT has simplified this process for me. I’ve found it incredibly helpful for creating infographics quickly and easily.
In this blog post, I’ll show you exactly how you can use ChatGPT to create visually appealing infographics.
What Makes ChatGPT Great for Infographics?
You don’t need to be a graphic designer or even particularly creative to make beautiful infographics. Because ChatGPT is great at understanding text prompts, you only need to describe what you want, and it delivers infographics in minutes.
I’ve personally saved hours using this approach. Whether for blogs, social media, or presentations, ChatGPT-generated infographics look good and deliver information effectively.
What truly impresses me about ChatGPT is how well it interprets even vaguely defined requests. Often, my initial prompts are not highly detailed, yet the outputs still surprise me positively.
How to Create Your First Infographic with ChatGPT
The process is straightforward. Here’s an example prompt I frequently use:
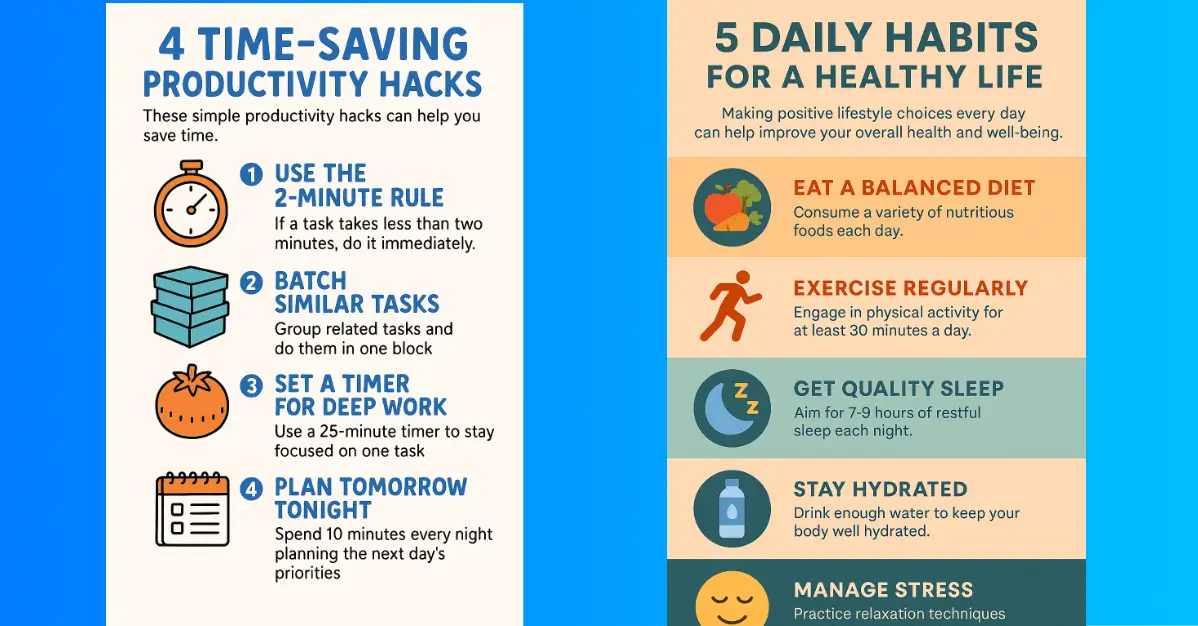
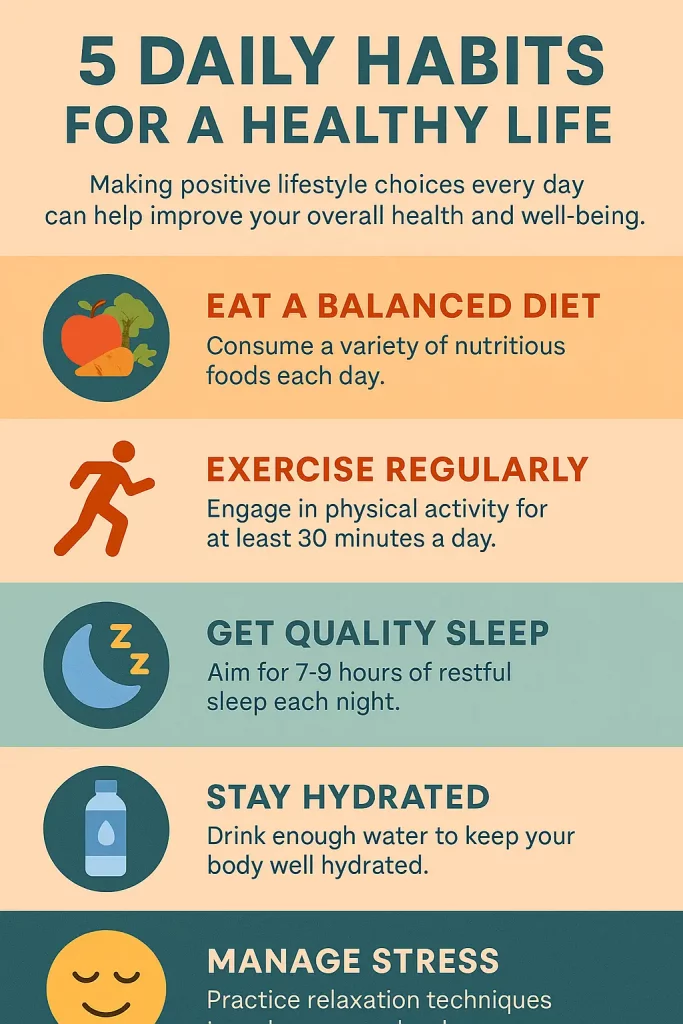
Create an infographic titled “5 Daily Habits for a Healthy Life”. Include a short intro, list the 5 habits with one-sentence explanations each, with icons for each habit, and a good-looking color scheme.
In this prompt, I only provided a title and a general request. ChatGPT produced the content, the layout, and even with suitable icons and colors.
The simplicity here is the key. You don’t need complicated instructions to get started. The basic prompt is enough to create a compelling visual aid that communicates your idea clearly. For beginners or those short on time, this approach is ideal.
Customize Your Infographic Completely
Sometimes, you’ll want more control over your infographic. That’s easy to manage. Here’s how I’d structure a detailed prompt for more customization:
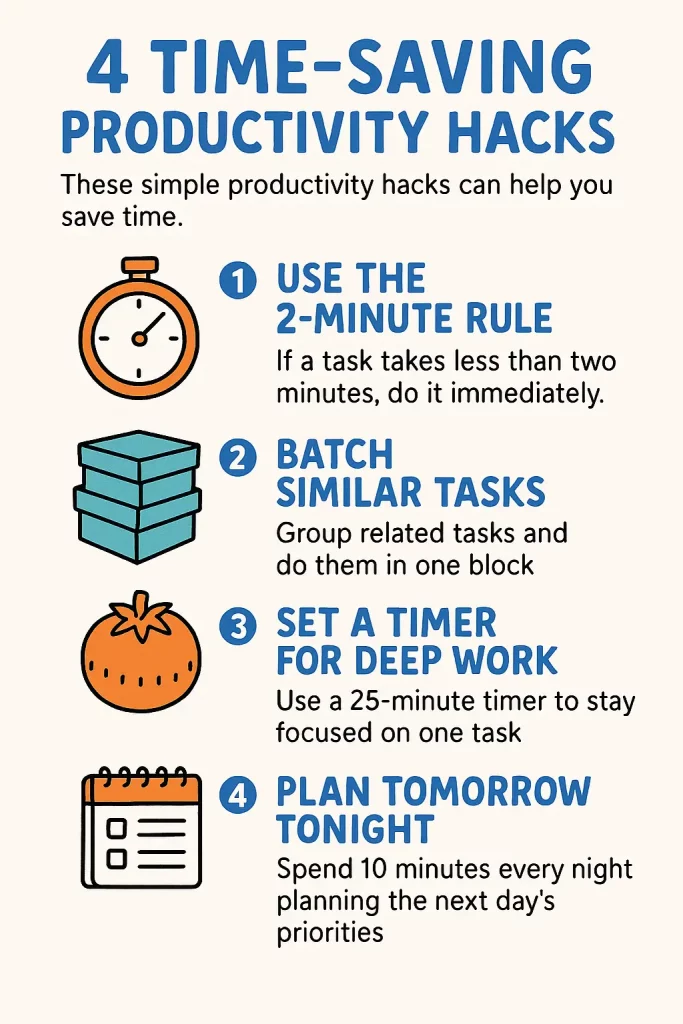
Create an infographic for the topic “4 Time-Saving Productivity Hacks”. Include the following details:
– Title: “4 Time-Saving Productivity Hacks”
– Short Intro: “These simple productivity hacks can help you save time.”
– Hack 1: Use the 2-Minute Rule
If a task takes less than two minutes, do it immediately.
Icon: Stopwatch or checklist
– Hack 2: Batch Similar Tasks
Group related tasks and do them in one block.
Icon: Grouped boxes or folder stack
– Hack 3: Set a Timer for Deep Work
Use a 25-minute timer to stay focused on one task.
Icon: Timer or tomato (Pomodoro symbol)
– Hack 4: Plan Tomorrow Tonight
Spend 10 minutes every night planning the next day’s priorities.
Icon: Calendar or notepad
Use the following color scheme:
– Background: White
– Headings: Blue
– Accent Colors: Orange, Cyan
Use the following layout/design style:
– Each hack placed in a separate section with icon and heading
– Playful style with hand-drawn icons
– 1:1 aspect ratio
By including specifics like layout, colors, icons, and even dimensions, ChatGPT creates precisely what you envisioned.
When I provide detailed instructions, I get outcomes that align perfectly with my vision. It helps eliminate guesswork, allowing me to produce exactly the infographic I need.
This detailed prompt approach works exceptionally well for specialized content or branding purposes.
Common Issues and Fixes
ChatGPT is a powerful tool, but sometimes it hits a few snags.
One common issue I’ve faced is having too much content. When the infographic feels crowded, ChatGPT might cut off parts of the text or visuals. In such cases, I simply ask:
Can you make the canvas bigger to accommodate all content?
ChatGPT quickly adjusts, providing a better layout.
Another issue is spelling mistakes or minor typos. Although rare, they do happen occasionally. A quick proofread helps catch these issues easily.
Occasionally ChatGPT might misunderstand specific instructions, especially with complicated layout details. When this happens, revising the prompt slightly or clarifying the layout description typically resolves the issue.
Advantages of Using ChatGPT for Infographics
The biggest advantage I’ve noticed is speed. Traditional infographic creation takes time. From planning to designing, it could take hours or even days. ChatGPT reduces this to mere minutes.
This means more content, more consistently. Plus, you don’t need subscriptions to expensive design software or to hire designers. It’s budget-friendly and practical.
Another significant advantage is consistency. ChatGPT-generated infographics maintain a coherent visual style that is easily replicable across multiple pieces of content. This consistency can significantly enhance your brand identity and recognition online.
Moreover, ChatGPT is exceptionally accessible. You don’t need technical skills or extensive experience in graphic design software. With simple typing skills, you can create engaging, attractive visuals that resonate with your audience.
Limitations You Should Be Aware Of
Despite its convenience, ChatGPT isn’t perfect. Complex visuals or intricate layouts might need manual adjustment or an external editing tool like Canva or Adobe Express.
Also, the quality depends heavily on how well you phrase your prompts. Clear, specific instructions yield the best results. Vague or ambiguous prompts often produce less satisfactory outcomes.
Furthermore, ChatGPT-generated visuals might lack the finesse or originality that professional designers bring. For highly specialized or branded infographics, combining ChatGPT’s initial drafts with additional refinement through external tools can yield optimal results.
Creating infographics with ChatGPT has simplified my content creation process immensely. It’s quick, effective, and accessible, even for those who have no prior design experience.
Give it a try, experiment with different prompts, and you’ll be creating eye-catching infographics in no time!